See the market
clearly.
TapAnalyst lets you compare any stocks and ETFs side-by-side with live data, flexible time ranges, and powerful chart tools — all in one clean, fast interface.
5Y+
Historical Data
Unlimited
Tickers on Pro
2
Free Tickers
$4.99
Pro per Month
Everything you need to read the market
Built for investors who want speed and clarity without noise.
Multi-Stock Comparison
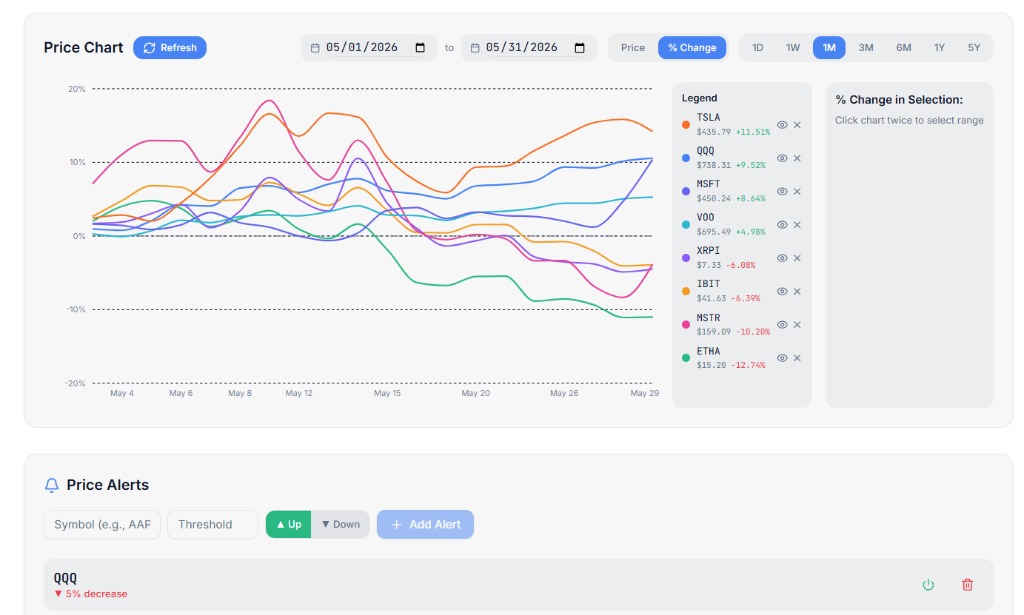
Layer multiple tickers on a single chart. Instantly see which assets are leading or lagging — no manual calculation needed.
Live Market Data
Prices refresh automatically. During market hours, 1-day charts update every minute so you're never trading on stale data.
Flexible Time Ranges
Jump between 1D, 1W, 1M, 3M, 6M, 1Y and 5Y with one click — or pick a custom date range down to the day.
Normalized % View
Toggle from raw prices to percentage-change mode to fairly compare assets across vastly different price levels.
Interactive Selection
Click any two points on the chart to measure exact gains or losses for every ticker over that window.
Instant Stock Search
Search thousands of equities and ETFs by name or ticker. Add them to your chart in under a second.
Secure & Private
Your watchlists and analysis are tied to your account. No one else can see what you're tracking.
Up and running in minutes
No setup. No configuration. Just sign in and start analyzing.
Sign in for free
Create your account in seconds.
Search any ticker
Type a symbol or company name and add it to your chart instantly.
Compare & analyze
Toggle time periods, switch to % change mode, and select ranges to measure performance.
Make better decisions
Walk into every trade with clear, visual context on how assets have moved.
Simple, honest pricing
Start free with two tickers. Upgrade whenever your watchlist grows.
Free
- Track up to 2 tickers
- Full price history up to 5 years
- Normalized % view and range analysis
- Custom date ranges
Pro
- Unlimited tickers
- Everything in the Free plan
- Compare your whole watchlist at once
- Cancel anytime
Pro is billed monthly and can be canceled anytime.
Market data should be fast and frictionless
Most tools bury the data you want behind menus, subscriptions, and clutter. TapAnalyst puts your charts front and center — search a ticker, hit Enter, and you're already looking at 5 years of price history.
- No Bloomberg terminal required
- Compare any two (or ten) assets instantly
- Switch from daily candles to a 5-year trend in one click
- Measure any period's return by clicking twice on the chart
Sample Analysis
$189.34
+2.14%
$378.91
+1.67%
$446.50
-0.38%
$38.12
+4.92%
Ready to take control of your market research?
Join TapAnalyst and go from question to chart in under 10 seconds.
No credit card · No setup · Instant access